
Responsive Web
With the majority of web views now on smart phones it is imperative to have Responsive presentations that adapt to all devices. Whether it is desktop, laptop or phones the images and text and layout will expand or contract to give the viewer an accurate display of your content. This is done through advanced software. This is the expertise that Jimmy ONeil Studio employs. See this example of our work in real time by going to Law Office of Erin Bradbury
Charts
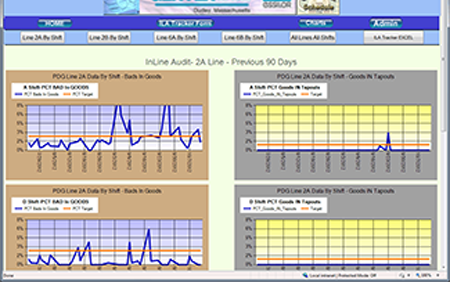
ILA Program (INLINE Audit)- QA ordered this one as quality of each optical lens is of utmost importance. At the end of each degating station is an inline auditor double checking the ‘Bads in Good’ and ‘Goods in Tapouts’. Now this data is done digitally with an aspx Web form consisting of drop downs, text boxes and Submit button. The auditor just scans the tray barcode, inspects, and enters a few keystrokes of data. The data is serialized to a 2008 R2 database and admin Gridview reporting, MS charts are available to the Group Leads. This used to be done with hand written sheets, then hand entered into Excel. What a savings!
Cisco Switch Programmer
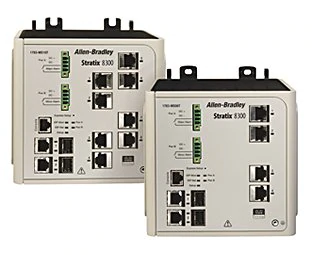
Configured over 200 Cisco switches within LAN and compiled all Visio drawings and blueprints. Implemented all VLANS and created TCP rules for trunks. Configured Routing tables and provided access to SQL Servers for transactional serialization. Worked hand and hand with Rockwell Logic 5000 programmers for optimal throughput to PLCs. This system featuring Magna Motion Conveyor Systems surpassed all Proof of Concept goals and now does Quality Assurance Inspections on 70,000 eyeglass pucks per day.
Dashboards
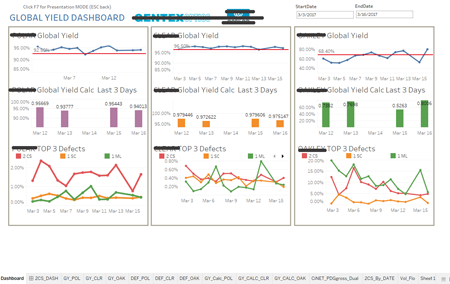
With the advent of Business Intelligence software like Tableau and Power BI, visualizations can be delivered to the desktops and mobile devices of the decision makers. It was not long ago that cube making and presentaions would take a huge analytic team. Now data can connect and be viewed with fairly low resources. Dashboards utilize several datasets to give leadership and department heads the insight they need to run an efficient operation. Here is an example of my accomplishment designing a dashboard reporting daily Global Yields.
Integration
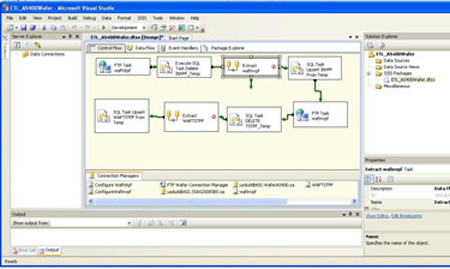
SSIS (Integration) – Utilizing another of the great tool packages in the Business Intelligence program is SSIS. It is used to simplify the task of Extraction, Transfer and Loading (ETL) of disparate data sources, into a functioning operational dataset. Knowing the tools and converting data at a manufacturing plant which spans AS400 IBMs to several legacy SQL;Excel; Access; etc makes it a lot easier. The department supervisors don’t care how you manipulate the data, they just want to see the report they need.
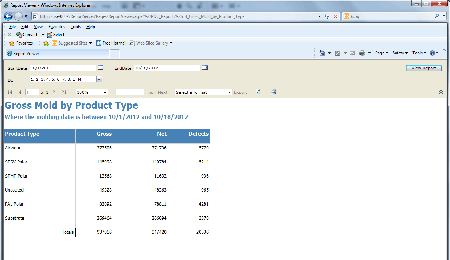
SSRS SQL Report Server
– Utilizing another of the great tool packages in the Business Intelligence program is SSRS. Whether you use Crystal Reports or SSRS this tool in the BIDS program of SQL gives fast figures to the supervisors and leadership team. They have hands on control by choosing their specified parameters and can easily export it to an Excel format so they can make their Pivot tables and charts. They can go into a meeting with the data they need.
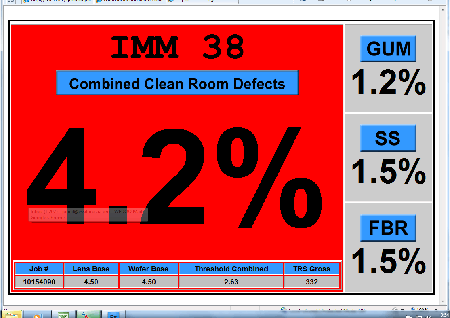
Clean Room Monitor Screens
– The Continuous Improvement Group set up a QRQC (Quick Response Quality Control) Committee to deal with the specific defects in the clean room (Surface Scratch, Gum, and Fibers) This screen prominently displays performance not only for the supervisor but also the operator at that station. Ostensibly a very simple screen but with a SQL backend procedure that uses a SQL cursor that captures ‘running totals’ of each job per shift, per wafer peeler. The Agent is updated every 4 minutes which is estimated ‘cycle time’ of each Insert Injection machine. The screen turns red if nominals are over threshold.